GTA Real Estate Market Holds Steady as Affordability Improves – June 2025 Update
Market Overview – June 2025
The Greater Toronto Area (GTA) real estate market continued its journey toward improved affordability in June 2025. The average selling price and borrowing costs remained lower compared to the same period last year, providing some relief for potential buyers. However, despite this positive shift, many prospective homeowners continued to delay purchasing decisions amid ongoing economic uncertainty.
Sales Activity
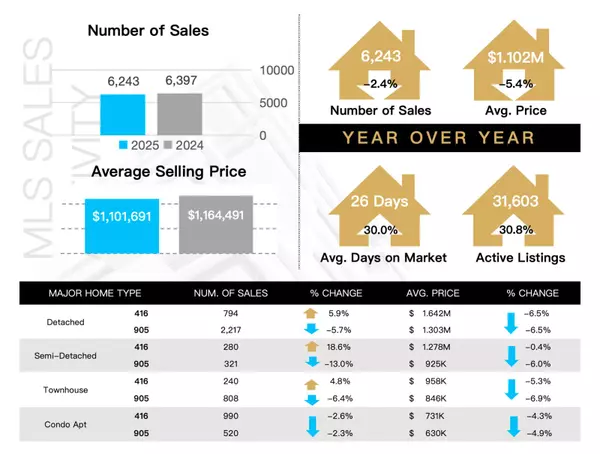
According to the latest figures released by TRREB, there were 6,243 home sales across the GTA in June 2025, reflecting a 2.4% year-over-year decline from June 2024. This modest drop indicates that while buyer sentiment remains cautious, activity levels are still resilient, particularly given broader macroeconomic conditions.
Home Prices and Affordability
The average selling price in June stood at $1,101,691, marking a 5.4% decrease from June 2024. Despite this annual decline, prices have remained relatively stable month-over-month, suggesting that the market is stabilizing and potentially setting a foundation for gradual growth in the coming months.
Importantly, this price adjustment, alongside lower borrowing costs, is contributing to improved affordability, an encouraging sign for first-time buyers and those considering re-entering the market.
Average Days on Market
Homes in the GTA spent an average of 26 days on the market in June, an increase of one day from May. Year-over-year, this represents a 30% increase in time on the market, signaling a shift towards a more balanced, or even buyer-leaning, environment.
Inventory and Listings
Active listings surged by 30.8% year-over-year, reaching 31,603, as more sellers entered the market. A total of 19,839 new listings were recorded in June, resulting in a sales-to-new listings ratio of 31.5%, further reinforcing current buyer-favored conditions.
Breakdown by Home Type
Here's a summary of performance by home category, as presented in the attached market snapshot:
| Home Type | Region | Sales | Avg. Price | YoY Price Change |
|---|---|---|---|---|
| Detached | 416 | 794 | $1.642M | ▼ 6.5% |
| 905 | 2,217 | $1.303M | ▼ 6.5% | |
| Semi-Detached | 416 | 280 | $1.278M | ▼ 0.4% |
| 905 | 321 | $925K | ▼ 6.0% | |
| Townhouse | 416 | 240 | $958K | ▼ 5.3% |
| 905 | 808 | $846K | ▼ 6.9% | |
| Condo Apartment | 416 | 990 | $731K | ▼ 4.3% |
| 905 | 520 | $630K | ▼ 4.9% |
Sales were mixed across categories, with semi-detached homes in the 416 area showing an 18.6% sales increase, suggesting strong interest in this segment. Other categories witnessed declines, reflecting broader trends of buyer hesitation and market recalibration.
Conclusion
While year-over-year metrics show a softening in prices and sales volumes, the current landscape is more favorable for buyers than it has been in recent years. Improved affordability, rising inventory, and moderate borrowing costs are all contributing to a more balanced housing market.
However, economic uncertainties continue to influence buyer sentiment, and many are taking a wait-and-see approach before making long-term commitments. As we move further into 2025, any shifts in interest rates, inflation, or employment figures could have a noticeable impact on market direction.
Need Help Navigating the Market?
If you are considering buying, selling, or investing in the GTA real estate market, I would be happy to provide you with personalized insights and guidance. Please don’t hesitate to reach out for a consultation or further market analysis.
Categories
Recent Posts